COLUMN: As the reality of potential ‘carbon tariffs’ hit the Australian Government, the big question is what we can export in future to maintain economic growth.
The Minister for Energy and Emissions Reduction, Angus Taylor, writing in The Australian last week, attempted to argue that proposed EU tariffs threatened the confidence the liberal democracies are building in the benefits of free and open trade.
The issue of concern was the EU’s proposal to impose tariffs through a Carbon Border Adjustment Mechanism. Quite reasonably, the EU feels domestic producers should not face an unfair cost disadvantage due to the European carbon price.
The EU’s action to impose the tariff is unsurprising; it was one of the major reasons advanced against the Rudd Government putting a price on carbon in advance of global agreements. The failure of COP 15 in Copenhagen in 2009 to reach a strong agreement was the primary cause of Rudd’s uncertainty, which, in turn, was a significant part of his downfall.
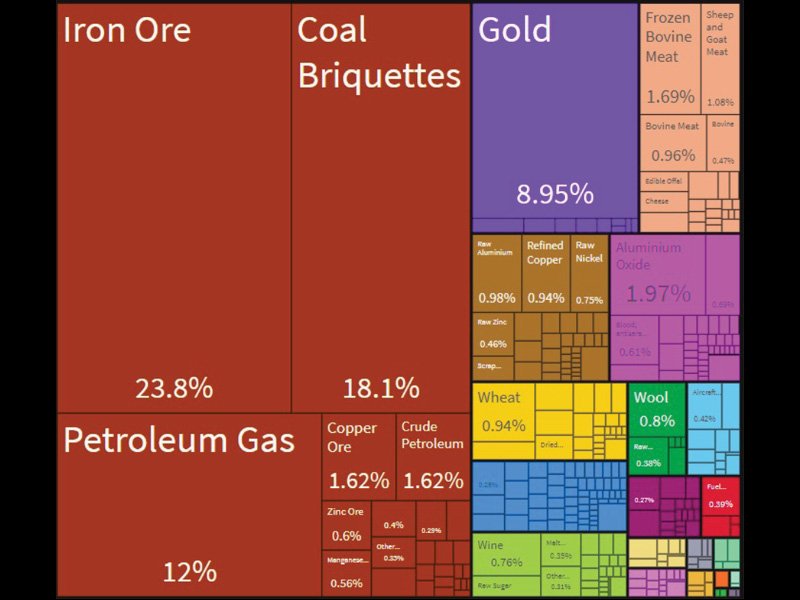
But in the final analysis, the exports that Taylor listed of concern (aluminium, cement, steel and eventually agriculture) aren’t a significant section of our exports. The chart below from the Observatory of Economic Complexity shows Australian exports by trade value by product in 2019.
Europe as a whole is also a relatively small component. Over 50 per cent of our exports go to just two countries – China and Japan.
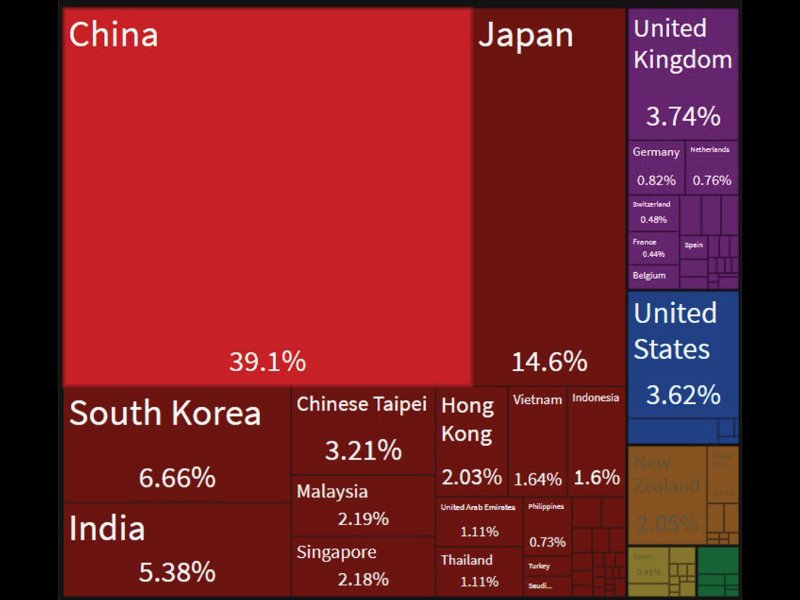
Readers are encouraged to visit the site to gain a deeper understanding of the patterns of trade. Some examples include 78.8 per cent of exports to the UK are gold, 18.8 per cent of our exports to Germany are pharmaceutical products, 12.4 per cent of our exports to the Netherlands are instruments and apparatus.
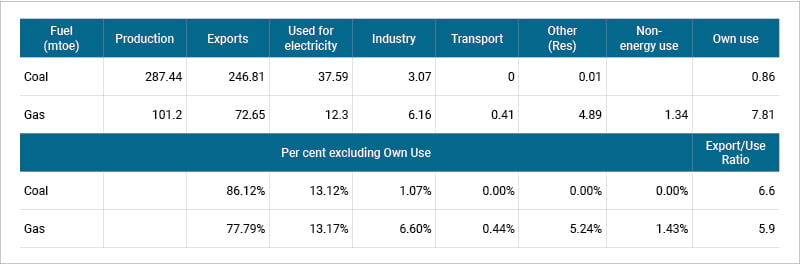
To put the export question into context, Australia exports six times the domestic use (excluding industry self-use) of coal and gas (see endnote 1). As a result, the economic consequence to Australia of our own emissions reduction policies (or non-policies) is repeatedly over-estimated. A ‘just transition’ for workers doesn’t depend on what we do with our electricity – it depends on what others do.
The three most prominent destinations of coal exports are Japan, India and China (at 24.6 per cent, 23.5 per cent and 18.2 per cent, respectively) and for natural gas are Japan, China and South Korea (at 43 per cent, 34.7 per cent and 9.79 per cent). So what are these countries doing?
The Morrison Government is not unaware of this trade concentration, though it has declined to take action on a Senate Committee’s recommendations on trade diversification.
The IPCC’s Sixth Assessment Report unequivocal conclusion that ‘human influence has warmed the atmosphere, ocean and land, and that this change is accelerating will result in stronger and faster action by the community of nations.
The biggest economic question for Australia is not the rate at which it might decarbonise – important as it is – but what our future export industries will be.
The Prime Minister’s response to the IPCC’s report was, as always, underwhelming. He chose the ‘we have to let developing nation’s catch-up’ argument but argued these countries generate two-thirds of emissions (see endnote 2). The Australian even reported the PM’s comments as:
Scott Morrison says reducing emissions in China, India and other developing nations is the only way to avoid catastrophic climate change
That is precisely what these countries are committed to. President Xi has committed China to reach peak emissions by 2030 and net-zero by 2060. India isn’t yet committing to net-zero by 2050, but has pledged to reduce emissions by 33 per cent of 2005 levels by 2030. Last month the Indian Minister said they were on track to exceed that target.
But, across the two fuels, our biggest market is Japan. Japan is not only committed to net-zero by 2050, but it has also increased its immediate goal to reduce emissions by 46 per cent on 2013 levels by 2030.
Of more direct significance to Australia is the draft energy mix policy released by Japan last month. Coal’s share of electricity production will be reduced from 26 per cent to 19 per cent, while gas will be reduced from 56 per cent to 41 per cent.
The Prime Minister remains stuck in his ‘technology not taxes’ rhetoric without really doing anything on technology while his Government denies the parliament a Parliamentary Office of Science and Technology.
Minister Hume is apparently unable to distinguish between advice to government and advice to parliament.
This is a truly ‘conservative’ government, unwilling to address change in any substantive way.
When change is affecting something as fundamental as climate, and its repercussions so great for the economy, something more is required.
Endnote 1: Australian use and export of coal and gas
The Sankey diagram (from the International Energy Agency) below shows Australia’s energy supply sources and uses.
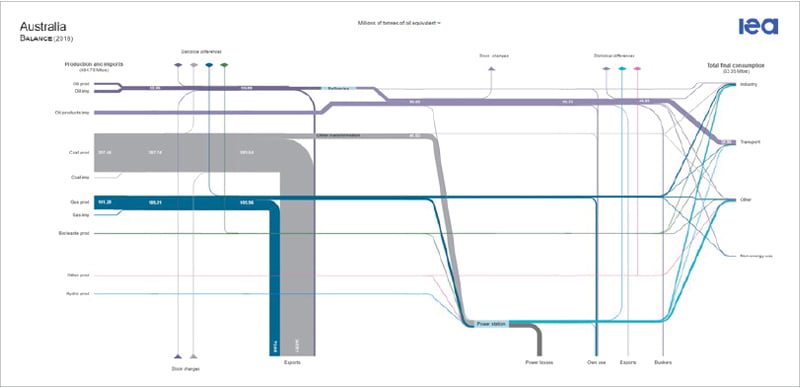
After allowing for consumption in production, we export six times as much coal and natural gas as we consume domestically.
Endnote 2: Emissions by country
Scott Morrison claims that developing countries account for twice the emissions of developed countries. This claim is accurate but misleading.
The World Bank publishes emissions per capita data (for 2018) with a data set that labels countries as either High, Upper middle, Lower Middle or Low Income. Using population data (also from the world bank, but for 2015), we can convert these to emissions data and calculate the total emissions by income group. The data is presented below (noting China is classed as Upper middle income).
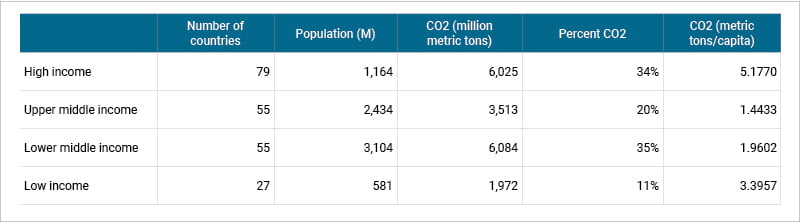
The telling issue remains the emissions per capita, with high-income countries at two and a half to three times more than the middle-income countries. The low-income countries have high emissions because much of their energy still comes from burning wood or dung.
The Indian Minister referred to earlier claimed that some countries per capita emissions are up to nine times more than the global average without naming any country.
This claim isn’t entirely accurate – the global average is 4.48 tonnes per person, while Qatar is the highest country at 32.41. Australia, Canada and the US all make the top ten at over 15 tonnes per person.
We don’t get to net-zero by raising the developing countries’ emission levels to those of the developed; the developed must get theirs down.
So, Australia, like our major export markets, should be committed to net-zero by 2050 and deeper reductions by 2030.
The actions other countries are already taking will have the biggest economic impact on Australia. Yet, all the while, the so-called champions of our mining sector – the Nationals like Joyce and Canavan – are holding the nation hostage on our climate action while doing nothing to help the mining communities that will see exports disappear.
David Havyatt is a former adviser to Federal ministers and a longtime observer of Australian innovation policy.
Do you know more? Contact James Riley via Email.
Great article, thanks. It appears that the exports in the diagrams are goods only, not services. Australia’s third largest export was education, and industry comprehensively neglected by the government in its support packages after the COVID19 outbreak. That export value is now expected to roughly half, a drop of $20 billion. At the same time they expect technology, not taxes, by not investing in the university sector. Brilliant.