When Anthony Albanese said he did not know the unemployment rate, he should have said that no one really knows the unemployment rate. When Scott Morrison claimed there are more Australians in work than ever before, he stated the truth, but it was not as significant as he made it sound.
The fact that the government keeps on announcing job creation programs suggests they don’t really believe the unemployment rate is 4 per cent and falling. While we know the global energy transition will see some jobs disappear, there are not as many jobs affected as the job creation programs suggest. The real picture of employment in Australia hinges on questions of what you count as the workforce and who you count as employed. Analysis suggests the government is right to be worried.
In the 2022-23 Budget, the Liberals noted that the national accounts measure of wages is expected to grow faster than the Wage Price Index. In addition, the ABS publishes two sets of employment statistics, the Labour Force statistics and the Labour Account.
There are two important differences between the series. The first is that the Labour Account includes three classes of people not included in the Labour Force statistic: child workers, defence personnel, and short-term non-resident workers. The second is that the Labour Force is published monthly while the Labour Account is only published quarterly, with the latest being December 21 and March 22 not being released till June.
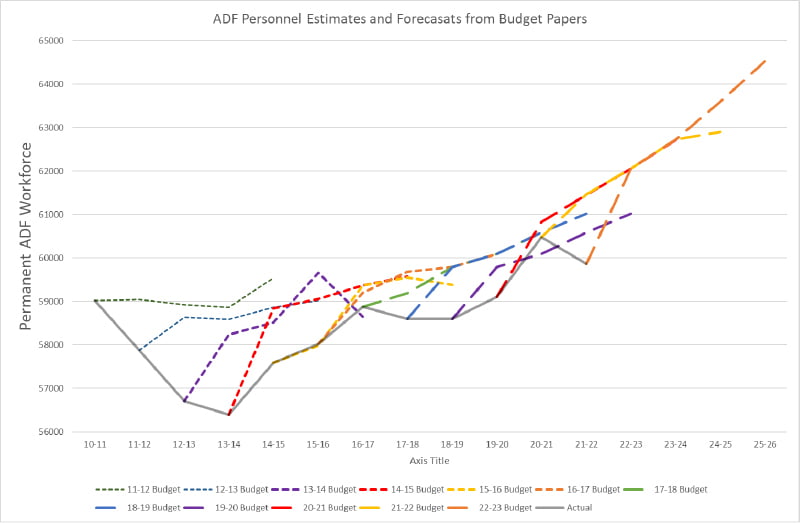
We can reverse engineer the Labor Force data for some purposes by adding defence personnel. The Department of Defence budget statements provide estimates of permanent ADF for the prior year and four years of forecasts. It turns out that Governments have a habit of overestimating the future growth of the ADF.
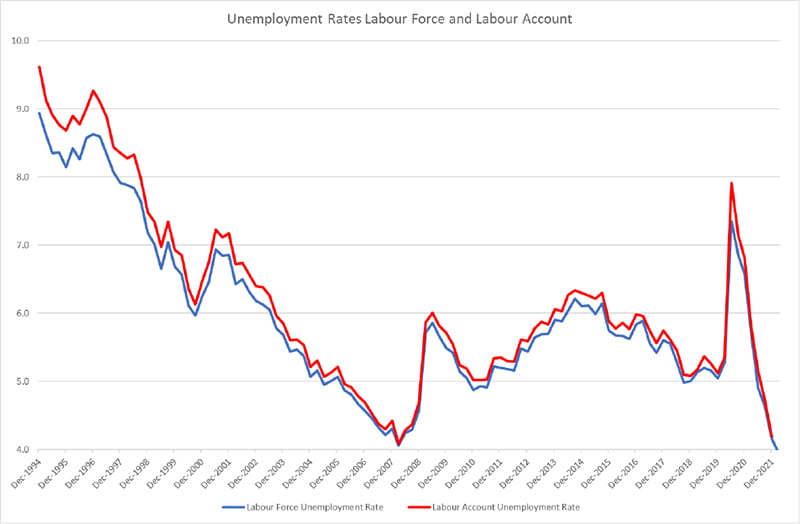
On the surface, both the Labour Force and Labour Account data tell a similar story on the unemployment rate, though the labour account unemployment rate is slightly higher. In noting that, we should recognise that two of the three categories of extra persons included in the Labour Account are, by definition, employed (defence and child workers). We have not included the unemployment rate for our augmented Labour Force statistic because it has a minimal effect (e.g. 4.16 per cent raw LF versus 4.14 per cent for LF+Defence in December 2021).
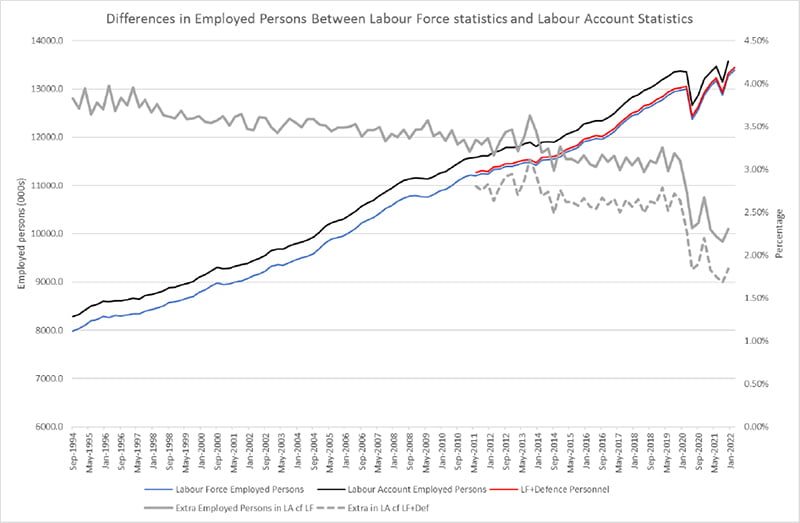
The more interesting trend is the difference between the number of employed persons measured by each series and the difference between them as a percentage of the employed persons from the Labour Force statistics. This time we include both the raw Labour Force statistic and the one augmented for defence personnel. This chart very dramatically shows the impact of the loss of workers on short-term visas through the pandemic. The gap of about 0.75 per cent from the pandemic’s start to December 21 represents the number of jobs that temporary visa holders rather than residents would have filled.
But if that doesn’t confuse the statistics enough, there are two more that put into question the idea that unemployment sits at 4 per cent
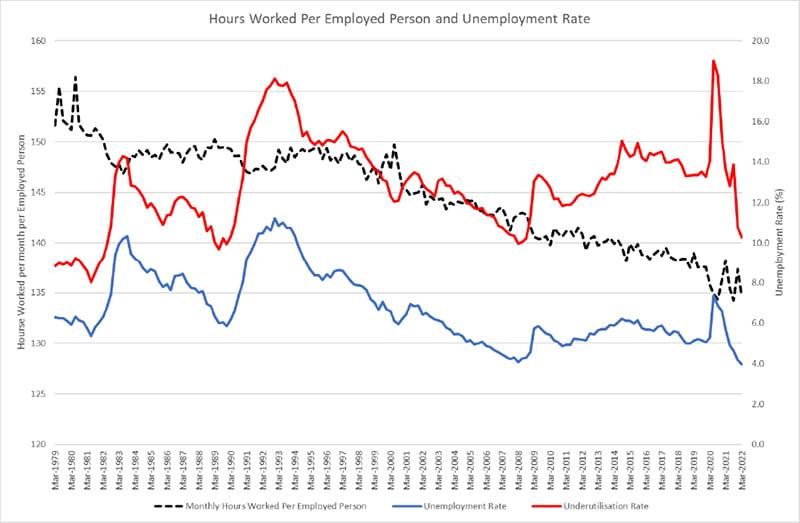
The first is obtained by simply including the underemployment rate with the unemployment rate. An underemployed person is one in a job looking for extra work. And that can be a lot of people given that a person is categorised as employed if they worked for one hour.
The ABS calls the sum of the unemployment rate and the underemployment rate the under-utilisation rate. Unsurprisingly growth in the under-utilisation rate compared to the unemployment rate is accompanied by a decline in the average hours worked.
If the ABS were to count the labour force the same way businesses do, they would count everything as a version of full-time equivalence (for the individual worker). So a person who worked 20 hours a week but wanted to have worked 40 hours a week would be counted as half an employed person.
But unfortunately, the definitions the ABS uses were developed by economists rather than accountants. So we can say that the unemployment rate on an FTE measure would be more than 4% but not as high as the under-utilisation rate of 10 per cent.
The second way to measure unemployment is to count the number of people receiving unemployment benefits. The Department of Social Security has published the data since March 2020 on data.gov.au and earlier on their website.
There are two unemployment benefits. Youth Allowance (other) is paid to people 21 years or younger looking for work, and JobSeeker is paid to those 22 or older. We have used the Labour Force workforce as the divisor and have used a dotted line to show how the current rate of these benefit payments compares to previous periods.
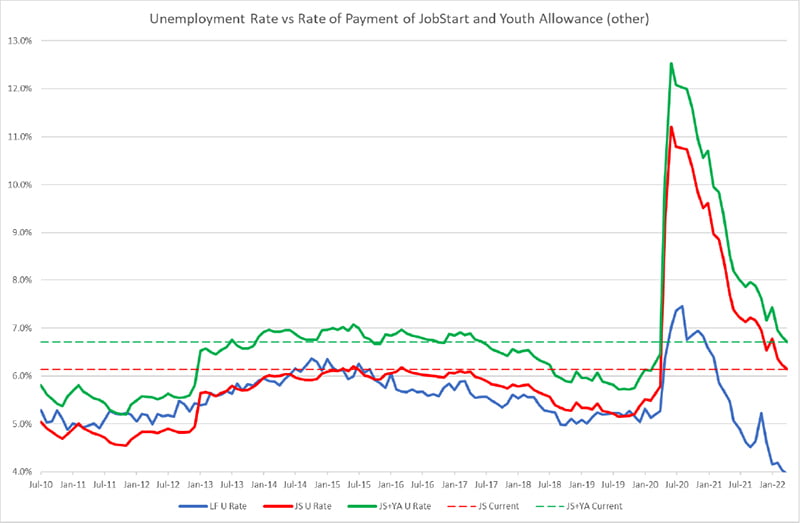
You would typically expect the reported unemployment rate to sit between the rate of people receiving JobSeeker and the rate of people receiving either JobSeeker or the Youth Allowance (other). It was very solidly there till 2013. From then to the start of the pandemic, the unemployment rate and JobSeeker recipient rate have been very close.
However, the performance in benefits payment has not matched the claimed recovery in unemployment. Both rates are well above the levels applied before the election of the LNP, and for JobSeeker payments they are still at the highest levels through the entire term of the LNP government.
The explanation for the discrepancy lies in the definition of ’employed person.’ A part-time worker who is looking for full-time work can receive JobSeeker.
The real question is on what number should the government focus. Should it be crowing about the 4 per cent rate, or should it be concerned that the rate is almost a percentage point lower because persons on temporary visas aren’t doing some jobs? Should it be more concerned that the under-utilisation rate is 10 per cent or that between 2 per cent and 3 per cent of the workforce has a job but needs income support?
This is a genuine concern. It isn’t that the unemployment rate relies on a definition of employment that under-reports the rate. The situation is that the Liberals have plenty of other data to tell them that the employment picture is nowhere near as strong as they claim. Whether that is because the Liberals are intentionally misleading the public or because they really don’t understand the numbers themselves is a matter of judgment.
But to help form that judgement, consider this tweet earlier this month by Scott Morrison.
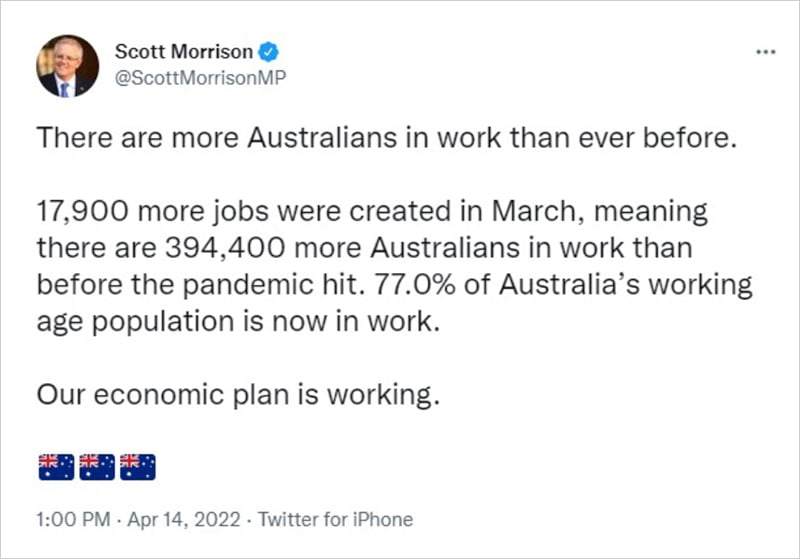
As the chart below shows, there being more Australians in work in any one month than ever before is the norm. More Australians have been employed than ever before in 303 of the 529 months the ABS has published the Labour Force statistics.
Three periods where this doesn’t apply stand out – 27 months of the Fraser recession, 48 of the Keating recession, and 16 for the Morrison recession. There is a further block of 11 for the GFC.
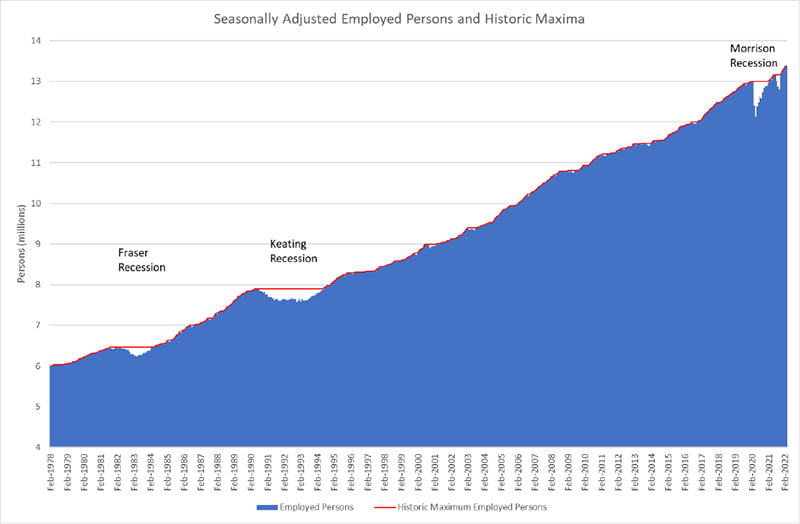
The Morrison recession deserves that title because we went into 2020 in such poor shape. A little more substantial underlying growth before the pandemic, rather than the poor December quarter, and reduction from the early pandemic effect in March would not have been negative growth.
As the employment chart shows, the ‘two-quarters of negative growth’ definition of a technical recession is just a definition. The GFC certainly caused a mild employment recession.
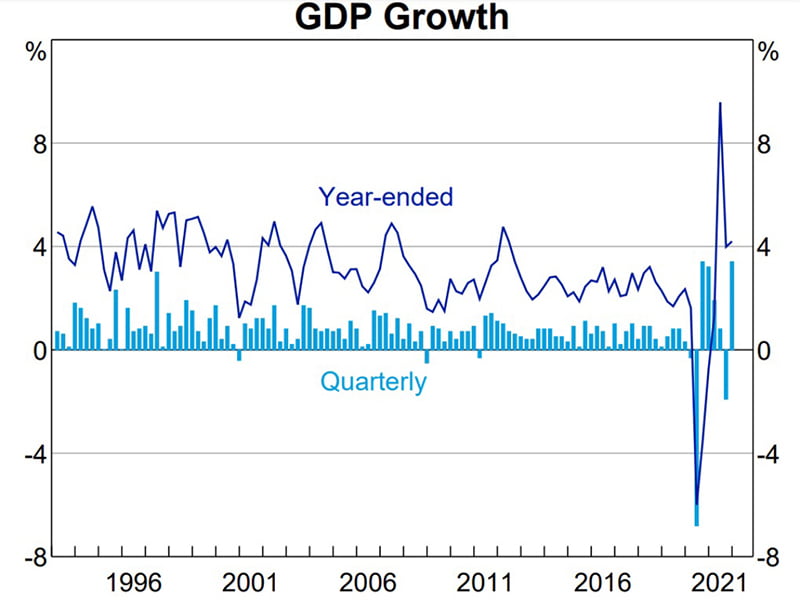
The boost to GDP growth post the recession has been driven by high net exports based on commodity growth. Recent days have seen a collapse in commodity prices in response to the unfolding COVID situation in China.
The government needs to be honest about the economy’s performance, not put a positive spin on it because that is what suits its election campaign narrative. And journalists need to ask fundamental questions about unemployment, not stunts.
The response needs to be enduring innovation and productivity policies, not the sugar hit of big announcements without follow through.
Do you know more? Contact James Riley via Email.
Abbott changed how ABS collects/expresses employment data in order to hide the real numbers.
It’s that simple.
Great article and much appreciated the fuller understanding behind the headlines.